
If you’re looking to buy, sell, or invest in New York or New Jersey, understanding the market is no longer optional—it’s essential. The 2025-2026 real estate landscape is being shaped by fluctuating interest rates, shifting inventory levels, and evolving buyer demand. As Staten Island’s leading real estate brokerage, the team at Robert DeFalco Realty has analyzed the data to bring you the definitive guide to NY NJ real estate market statistics.
This guide provides a comprehensive overview of the trends impacting the entire region, from the five boroughs of NYC—including Brooklyn and Queens—to the growing suburbs of New Jersey. We’ll also provide a special “deep dive” into the Staten Island real estate market data that we analyze every day, giving you the expert insights needed to make your next move with confidence.
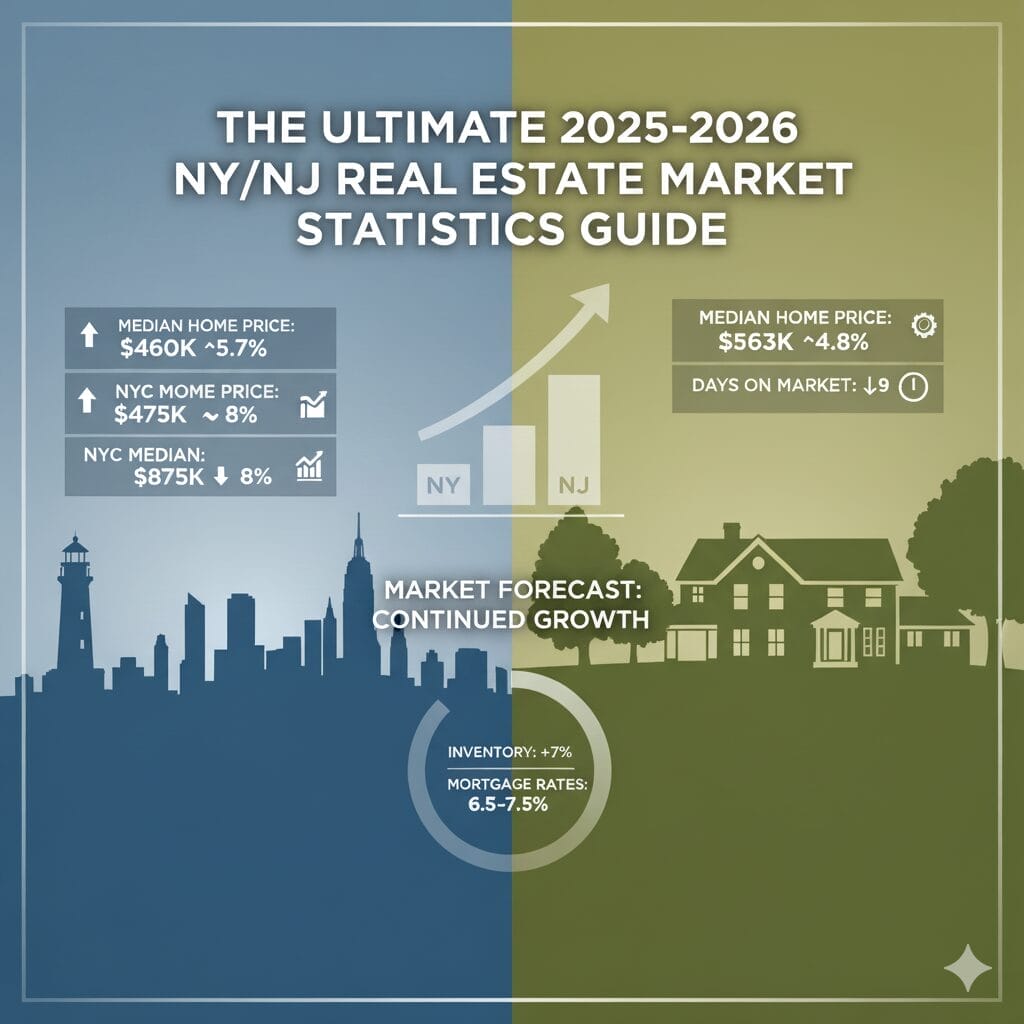
Executive Summary: NY/NJ Real Estate Market at a Glance (2025-2026)
The 2025-2026 period for the New York and New Jersey real estate market can be defined by one word: “normalization.” After years of unprecedented highs and lows, we are seeing a return to more sustainable market dynamics.
Here’s what our analysis of the latest real estate market trends NY 2025 shows:
- Price Growth Moderating: Median home prices in both NY and NJ are still appreciating, but at a slower, more sustainable single-digit pace compared to the double-digit jumps seen in 2021-2022.
- Inventory Remains Tight: While inventory is slowly ticking up, it remains well below pre-pandemic levels. This “inventory crunch” continues to be the primary factor keeping prices stable, even with higher mortgage rates.
- Days on Market (DOM) Increasing: Homes are sitting on the market slightly longer. The days of weekend-long bidding wars are fading in many areas, giving buyers more time and negotiating power.
- The “Flight to Quality” Continues: Buyers are more discerning. Updated, move-in-ready homes are commanding a premium, while properties needing renovation may require more strategic pricing.
Key 2025-2026 NY/NJ Real Estate Market Statistics (The Core Data)
This section dives into the four most important metrics that define the health and direction of the housing market.
Statistic 1: Median Home Prices (NY vs. NJ)
Median home price is the most-watched statistic, and the story varies significantly by state.
- New York (Statewide): The latest 2025 data shows the statewide median sales price climbing to $460,000, a steady 5.7% increase from last year. However, this number is heavily influenced by the high-value NYC housing market statistics. In New York City, the median sale price is closer to $875,000, reflecting an 8% rise as of September 2025.
- New Jersey (Statewide): New Jersey’s market has shown remarkable resilience. According to recent Redfin data, the statewide median price for a home is approximately $563,900, up 4.8% from this time last year. This growth is fueled by continued demand from buyers seeking more space, particularly those moving from NYC boroughs like Brooklyn and Manhattan.
Statistic 2: Housing Inventory & Supply
The story of the 2025-2026 market is all about supply. For the first time in years, buyers have more options, though inventory remains historically tight.
- New York: Inventory across New York State reached a three-year high in 2025, with over 30,000 homes for sale. This is a 5.5% increase in available homes compared to last year, which is helping to ease the intense buyer competition.
- New Jersey: The garden state has seen an even larger jump, with a 10.6% year-over-year increase in homes for sale.
- Months of Supply: Despite this growth, both states are hovering around 3-4 months of supply. A “balanced” market is typically 6-7 months. This means we are still firmly in a seller’s market, although it is less frantic than in previous years.
Statistic 3: Days on Market (DOM)
How long does it take to sell a home? This statistic reveals the “speed” of the market.
- NY DOM: The average Days on Market in New York is approximately 40-60 days. Homes in high-demand areas of NYC may sell faster, while statewide properties are seeing a more normal sales cycle.
- NJ DOM: New Jersey homes are moving slightly faster, with a statewide average of 45 days on the market. This is 9 days slower than last year, confirming that buyers have more time to think and conduct due diligence than they did two years ago.
Statistic 4: Impact of 2025 Mortgage Rates
We cannot discuss NY NJ real estate market statistics without addressing mortgage rates. As rates have settled in the 6.5% – 7.5% range for much of 2025, buyer affordability has been stretched. This has “gated” the market, removing many first-time buyers and creating a more serious pool of well-qualified purchasers. Most 2026 forecasts show rates potentially easing, but staying in the 5.8% – 6.5% range, meaning today’s rate environment is the “new normal” for now.
A Deep Dive: Staten Island Real Estate Market Data (Our Expertise)
As Staten Island’s top-ranked real estate brokerage, we don’t just watch the trends—we live them. The Staten Island real estate market data shows a unique and resilient micro-climate that stands apart from the rest of NYC. We analyze this data daily to give our clients a winning edge.
Staten Island Home Price Trends (2025-2026)
Staten Island remains one of NYC’s most desirable boroughs for its blend of suburban lifestyle and city access. As of late 2025, the median sales price for a home in Staten Island is holding strong, hovering between $730,000 and $750,000, a 4-5% increase from the previous year.
We’re observing different trends by neighborhood, which is critical for both buyers and sellers:
- North Shore: With its proximity to the ferry and vibrant, historic neighborhoods, the North Shore (including areas like Grymes Hill) sees median prices in the $550,000 to $750,000 range, attracting commuters and first-time buyers.
- South Shore: The South Shore continues to be a powerhouse for its larger homes and strong school districts. Neighborhoods here, such as Annadale, command median prices from $700,000 to over $1 million.
Inventory in Staten Island’s Top Neighborhoods
Housing inventory in Staten Island is tight, especially for detached single-family homes in prime, high-value areas. Homes that are well-maintained and priced at market value are still receiving multiple offers.
In exclusive neighborhoods like Todt Hill, where listings often exceed $1.5 million, inventory is particularly scarce. This scarcity keeps values high and makes local expertise essential for buyers looking to find a property.
What This Data Means for Staten Island Sellers & Buyers
For sellers, this data means it is still an excellent time to list your home, but preparation is key. Buyers are patient and will wait for a home that checks all their boxes. For buyers, the 2025-2026 market requires persistence. Getting pre-approved and working with a local agent who has access to off-market listings (like our team at Robert DeFalco Realty) is crucial.
Thinking of selling? The market is strong, but your home’s value is specific. “Zestimates” can’t account for local nuances. Get a precise, data-backed home valuation from a Robert DeFalco expert who understands your specific street.
Get Your Free Staten Island Home Valuation
New York City (5 Boroughs) Market Breakdown
While we’ve covered Staten Island, the NYC housing market statistics show a diverse picture across the other four boroughs. The city-wide median home price is forecast to rise a healthy 4-6% in 2026, but where you look determines what you’ll find.
Manhattan Market Trends
The “return to office” movement has stabilized the Manhattan real estate market. With a median sales price of $1.24 million (a 3% year-over-year increase), the luxury and condo markets are showing particular strength. Days on market have actually decreased, showing that buyers are confidently making moves on high-end properties.
Brooklyn vs. Queens
Brooklyn continues to be a market leader, with median condo prices reaching $1 million. However, the market is normalizing; homes are sitting for an average of 118 days, giving buyers more time to choose.
For those seeking more value, Queens remains a hotbed for both first-time buyers and investors. The average home value has climbed to $736,291, a 3.9% annual increase, offering a compelling mix of commutability and affordability.
The Bronx Market Data
The Bronx shows the most nuance. While the median list price is around $330,000, demand for single-family homes is surging, pushing the median sales price for that property type up 7.4% to **$655,000**. This highlights a strong desire for space and value, a trend we see across the region.
New Jersey Market Analysis (North vs. South)
The New Jersey market is not monolithic. The NJ real estate market forecast 2026 depends heavily on where you’re looking, with a clear divide between the NYC-adjacent north and the more suburban south.
North Jersey Market Statistics (The NYC Suburbs)
North Jersey (e.g., Bergen, Hudson counties) behaves as an extension of the NYC market. In Bergen County, the median price for a single-family home has soared 11.6% to $880,000. However, the townhouse and condo market is shifting, with the median price at a more modest $532,500 and properties sitting for over 80 days—a clear sign of a more balanced, buyer-friendly environment in that segment.
Central & South Jersey Trends
Central and South Jersey offer more affordability but remain highly competitive. In Monmouth County, the median sales price is $705,000, and homes are moving incredibly fast, going into pending status in just 20 days. This market is defined by strong demand from buyers seeking more space, excellent schools, and access to the Jersey Shore, making it one of the most resilient markets in the tri-state area.
2025-2026 Real Estate Forecast: What to Expect in NY/NJ
Based on all the NY NJ real estate market statistics, what’s the verdict for the next 12-24 months? The consensus among most economists is a “return to normalization.” The frantic, over-asking-price pace of 2021-2022 is over, replaced by a more stable, balanced, and predictable market. A price crash is considered highly unlikely.
Here’s what our team at Robert DeFalco Realty anticipates for buyers, sellers, and investors.
Predictions for Buyers
The question we hear most is: “is it a good time to buy a house in NY 2025?” Our answer: It’s a challenging market, but it’s the smartest and most buyer-friendly window we’ve seen in nearly five years.
- Less Competition: The days of waiving inspections and offering $100k over asking are fading. With homes sitting slightly longer, you have more time to think and conduct due diligence.
- The “Marry the House, Date the Rate” Strategy: Buy the home you love now. Most 2026 forecasts, including those from Fannie Mae, predict mortgage rates may ease into the 5.8% – 6.2% range. If they do, you can refinance. Waiting for rates to drop will only bring a flood of buyers back, restarting the bidding wars.
- More Leverage: Buyers have more negotiating power on price and repairs than they’ve had in years.
Forecast for Sellers
The NJ real estate market forecast 2026 and NY trends both look positive for sellers, but expectations must be managed.
- Pricing is Everything: This is not 2021. You must price your home at its 2025 value, not its “dream” value. Overpriced homes will sit, while properties priced correctly at market value are still selling quickly.
- Condition Matters: In this market, buyers are more discerning. Homes that are updated, move-in-ready, and marketed professionally will sell fastest and for the highest price.
Investment Opportunities in 2026
For investors, the 2025-2026 market is all about multi-family properties. With high rental demand and ownership costs keeping many would-be buyers in the rental market, purchasing a multi-family property can be a strong long-term wealth-building move. We are seeing particularly strong fundamentals for multi-family homes in Staten Island, as well as in high-demand rental markets like Brooklyn and North Jersey.
How to Use This Data: A Guide for Buyers and Sellers
Data is useless without action. Here’s how our expert team at Robert DeFalco Realty advises you to apply these NY NJ real estate market statistics.
For Buyers: Navigating the 2025 Market
- Get Hyper-Local: The “NY/NJ market” is too broad. The “Staten Island market” is better. But the real data is on the specific block you’re interested in. You need an agent who can pull real-time comps for your dream neighborhood.
- Know Your Numbers: Get a rock-solid pre-approval from a lender before you start looking. In a 6.5% interest rate environment, knowing your exact monthly payment is the key to a confident and successful search.
- Be Patient, But Ready: With more inventory and longer Days on Market, you have time to find the right home. Don’t settle. But once you find it, be prepared to act decisively with a clean offer.
Ready to start your search? See the latest, most accurate listings in your target area, updated directly from the MLS.
Browse Homes for Sale in Staten Island & NJ
For Sellers: Pricing Your Home to Win in 2026
Market Like a Professional: In this market, you need professional photos, video tours, and a digital marketing strategy to find the right buyer. Sticking a sign in the yard is not enough.
Don’t Rely on “Zestimates”: Automated valuations are often inaccurate. You need a Comparative Market Analysis (CMA) from a local agent who has actually been inside your neighbors’ homes and knows why one sold for $50,000 more than the other.
Focus on Condition: This is not 2021. Buyers are patient and will “subtract” the cost of every project. A fresh coat of paint, updated light fixtures, and strong curb appeal are no longer optional; they are essential for getting top dollar.
Frequently Asked Questions (FAQs) about the NY/NJ Market
Q: Will the real estate market crash in NY/NJ in 2026?
A: No, a “crash” (like 2008) is extremely unlikely. The current market is defined by high homeowner equity, tight lending standards, and persistent low inventory—the exact opposite of the 2008 crisis. Experts agree we are in a market correction and normalization, not a crash. Most forecasts project modest, healthy price growth of 2-4% in 2026.
Q: Is it cheaper to rent or buy in NYC in 2025?
A: It is significantly cheaper upfront to rent, but it may be more expensive month-to-month. With NYC median rents at all-time highs (e.g., over $4,500 in Manhattan), a mortgage payment can often be comparable, all while building equity. The “break-even” point, where buying becomes more financially advantageous than renting, is typically between 5-7 years in this market.
Q: What is the most reliable source for real estate market statistics?
A: For a high-level national view, the National Association of Realtors (NAR) (httpsfor://www.nar.realtor/) is the industry standard. However, for the most accurate, hyper-local data, the only reliable source is the Multiple Listing Service (MLS). This is the real-time database that only licensed agents can access to create a Comparative Market Analysis (CMA) for your specific home.
Partner with Staten Island’s Real Estate Market Experts
Navigating the 2025-2026 NY/NJ real estate market requires more than just data; it requires expert interpretation. The statistics in this guide are your starting point, but the real advantage comes from working with a team that understands the nuances of your specific neighborhood.
The agents at Robert DeFalco Realty have been the market leaders in Staten Island and New Jersey for over 30 years. We don’t just see the statistics—we see the stories behind them.
Whether you’re ready to buy your first home, sell a long-time property, or find your next investment, we’re here to provide the data, expertise, and guidance you need.
Don’t just watch the market. Master it.