
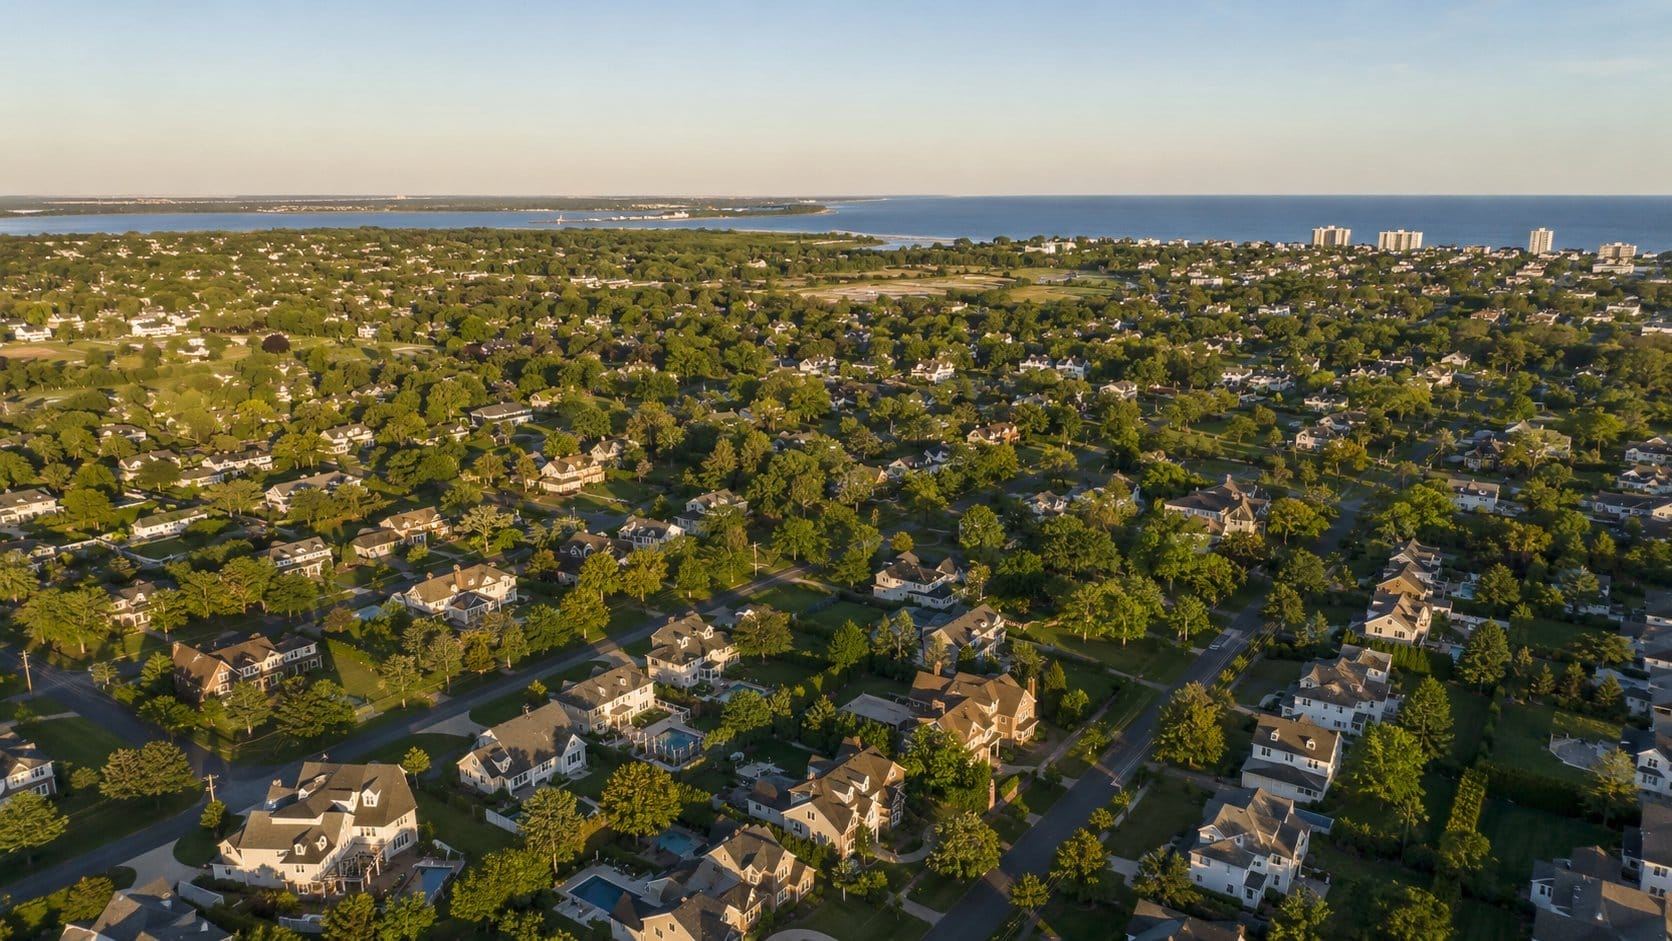
Monmouth County NJ housing market activity in May 2026 looks tighter than many buyers expected after a slow late winter. Here is the headline read. The county-wide median single-family sale price reached $745,000, days on market sat at 37, and active listing count stayed near 1,150 across the county. Robert DeFalco Realty tracks every town from Sea Bright to Matawan, and the spring read shows a market that is firm at the top, competitive in the family-town middle, and finally healthier at the entry level than it was twelve months ago.
The Monmouth County NJ housing market in 2026 is being shaped by three forces at once. Mortgage rates settled into the low 6s after a long ride higher. NYC transferees keep pushing into shore towns and North Jersey Coast Line commuter towns. And inventory finally crept up enough to give some buyers breathing room without flipping the market into a price-cut spiral. Let’s break it down by the data points that matter, then walk the town tape, then talk about what summer 2026 likely brings.
For deeper context on statewide trends, our Monmouth County NJ housing market read pairs with our New Jersey statewide market pillar and the most recent NJ housing market report from March 2026. For a cross-Hudson comparison, see the Staten Island real estate market report for May 2026.
In This Post
Monmouth County NJ Housing Market Snapshot (May 2026)
County-Wide Median Price
The Monmouth County NJ housing market posted a county-wide median single-family closing price of $745,000 in May 2026, per data tracked by member brokers reporting to monmouthrealtors.org and aggregated against Realtor.com county feeds. The median condo and townhouse closing price came in at $395,000. Single-family pricing is up 4.2% year-over-year from the May 2025 median of $715,000. Condo pricing is up 3.6% year-over-year, a slightly softer line because newer mid-tier condo supply finally opened up in Long Branch and Asbury Park.
Inventory and Months of Supply
Active listings finished May at roughly 1,150 across the county. Pending sales sat near 420. That puts months of supply at about 3.1, which is a step better than the 2.4 reading from May 2025 but still well under the 5 to 6 range that most analysts use as the line for a balanced market. Translation: Monmouth County home prices are not collapsing, and inventory has loosened just enough that buyers can actually tour two or three homes before writing.
Days on Market and Sale-to-List Ratio
Median days on market across the Monmouth County NJ housing market hit 37 in May 2026. Sale-to-list ratio sat at 99.4%, meaning the typical home closed within a hair of the asking price. Well-priced homes in Holmdel, Marlboro, Wall, and Middletown often beat both numbers, closing in under three weeks and over list. Overpriced homes in any town now sit. Buyers in 2026 are price-sensitive in a way they were not in 2022 or 2023.
Year-Over-Year and Month-Over-Month Movement
May 2025 vs May 2026
Compare the spring-to-spring move. The Monmouth County median single-family price climbed from $715,000 in May 2025 to $745,000 in May 2026, a 4.2% lift. Days on market shortened slightly from 41 to 37. Active listings climbed from roughly 980 to 1,150, an 17% rise in available choice. Pending sales rose from 385 to 420. The picture is more inventory, faster turn, and modestly higher prices. Sellers still set the pace, but not with the iron grip they had two years ago.
April 2026 vs May 2026
Month-over-month, the median price climbed from $735,000 in April to $745,000 in May. Days on market fell from 42 to 37 as the spring buyer wave finally cleared the carry-cost-shy crowd from winter. Sale-to-list ratio ticked up from 99.1% to 99.4%. The April-to-May curve looks like a textbook spring acceleration, just with rates a full point higher than the 5.5% buyers were hoping for.
Mortgage Rate Context for Monmouth County Buyers
The Freddie Mac Primary Mortgage Market Survey put the 30-year fixed at 6.52% in late May 2026. The 15-year fixed sat near 5.78%. Federal Reserve commentary has hinted at one possible cut later this year, but no buyer in Monmouth County should plan a purchase around a rate that has not happened yet. For a $745,000 median home with 20% down, principal and interest at 6.52% runs roughly $3,775 a month. Add taxes (more on that below), insurance, and HOA where applicable, and the monthly carry on a median Monmouth County home easily clears $5,200.
For buyers crossing the Hudson, our tri-state area guide for NJ home shoppers and our closing costs in New Jersey breakdown walk through every line item that moves the all-in number. For buyer-side strategy, the buyer’s agent NY and NJ guide explains how representation works in this market.
Monmouth County Home Prices by Town (May 2026 Table)
Below is the May 2026 Monmouth County housing market report at the town level. Median sale price, median days on market, and year-over-year price change are shown for each town we track. Robert DeFalco Realty pulls these reads from monmouthrealtors.org, Realtor.com county exports, and broker reciprocity feeds.
| Town | Median Sale Price (May 2026) | Median Days on Market | YoY Price Change |
|---|---|---|---|
| Rumson | $2,400,000 | 48 | +3.1% |
| Spring Lake | $2,100,000 | 41 | +5.4% |
| Colts Neck | $1,850,000 | 55 | +2.8% |
| Sea Bright | $1,550,000 | 44 | +6.1% |
| Fair Haven | $1,350,000 | 32 | +4.7% |
| Holmdel | $1,050,000 | 28 | +5.0% |
| Marlboro | $865,000 | 26 | +4.3% |
| Wall Township | $845,000 | 31 | +4.0% |
| Red Bank | $795,000 | 29 | +5.8% |
| Manalapan | $785,000 | 27 | +4.6% |
| Middletown | $755,000 | 30 | +4.1% |
| Asbury Park | $725,000 | 36 | +6.7% |
| Long Branch | $625,000 | 39 | +5.2% |
| Howell | $595,000 | 33 | +3.8% |
| Tinton Falls | $555,000 | 34 | +3.6% |
| Freehold | $545,000 | 35 | +3.9% |
| Hazlet | $545,000 | 30 | +4.2% |
| Matawan | $535,000 | 31 | +4.0% |
| Aberdeen | $495,000 | 32 | +3.7% |
Luxury Tier: Rumson, Colts Neck, Spring Lake, Sea Bright
Rumson real estate continues to anchor the top of the Monmouth County NJ housing market. The May 2026 median sale price was $2.4 million with a 48-day median time on market. Buyers in Rumson skew toward NYC finance professionals, returning empty-nesters from Manhattan, and trade-up families coming from Holmdel and Fair Haven. Colts Neck holds a $1.85 million median with longer days on market because much of the inventory sits on multi-acre lots that take a narrower buyer pool. Spring Lake is the shore-luxury counterpart with a $2.1 million median, driven by classic Victorian and beach-block inventory. Sea Bright at $1.55 million is the tightest peninsula market in the county.
Family-Town Tier: Holmdel, Marlboro, Manalapan, Wall, Middletown
This is where most of the volume sits. Holmdel at $1.05 million stays the school-driven crown jewel of the inland family belt. Marlboro at $865,000 and Manalapan at $785,000 trade buyers back and forth weekly. Wall Township at $845,000 picks up shore-adjacent families who want yard, garage, and a 12-minute drive to the beach. Middletown at $755,000 remains the biggest population center in the county and the swing town that often defines the broader Monmouth County NJ housing market headline. Days on market in this tier runs 26 to 31, the fastest band in the county.
Entry and Mid Tier: Howell, Freehold, Tinton Falls, Hazlet, Aberdeen, Matawan
For buyers chasing the most house per dollar inside Monmouth County, this is the cluster to watch. Aberdeen at $495,000 is the only town with a county-tracked median under $500,000. Matawan at $535,000, Freehold at $545,000, Hazlet at $545,000, Tinton Falls at $555,000, and Howell at $595,000 round out the sub-$600,000 group. These towns absorb most of the first-time buyer demand and benefit from Aberdeen-Matawan and Hazlet NJ Transit stations on the North Jersey Coast Line. For more on commuter value, our best New Jersey commuter towns to NYC roundup and affordable places to live in NJ guide line up neatly with this tier.
Shore Communities: Long Branch, Asbury Park, Sea Bright, Spring Lake
Shore inventory tells two stories at once. Long Branch at $625,000 and Asbury Park at $725,000 are still the most accessible coastal entries with year-round walkability, while Sea Bright and Spring Lake sit firmly in the luxury tier. Asbury Park led the entire county on YoY price growth at 6.7%, reflecting continued buyer migration from Brooklyn and Queens looking for shore-town energy without Hamptons pricing.
Red Bank and Fair Haven Spotlight
Red Bank real estate posted a $795,000 median in May 2026 with 29 days on market and 5.8% YoY price growth, one of the strongest reads in the county. The town’s downtown, NJ Transit station on the North Jersey Coast Line, restaurant density, and walkable layout keep demand elevated. Fair Haven at $1.35 million sits one bridge over, with a tighter inventory profile and a buyer pool that overlaps heavily with Rumson trade-ups. For neighborhood deep-dives, the Red Bank NJ neighborhood guide and Manalapan NJ neighborhood guide cover schools, commute, and lifestyle in detail.
Shore-Area vs Inland Monmouth County Real Estate Dynamics
Shore towns in the Monmouth County NJ housing market behave differently than inland towns and need a different playbook. Three differences matter. First, shore inventory turns more on second-home demand than on local school timing, which means peak shore listing activity hits late spring and again in early fall. Second, shore pricing is more sensitive to FEMA flood zone designation, which we cover next. Third, shore towns saw the highest YoY price growth in May 2026 (Asbury Park 6.7%, Sea Bright 6.1%, Spring Lake 5.4%), reflecting both NYC migration and second-home buyer return after a quiet 2024 stretch.
Inland family towns like Holmdel, Marlboro, Manalapan, and Middletown move on school calendar timing. Pending volume rises in March, closes peak from late April through July, and sellers who wait past Labor Day usually accept a lower number. Days on market is faster inland (26 to 31) than along the coast (36 to 48). For buyers, the strategy diverges: shore buyers should plan for flood, insurance, and elevation diligence, while inland buyers should plan for multiple-offer scenarios on under-$900,000 family homes.
FEMA Flood Zone Impact on Monmouth County Home Prices
A meaningful share of Monmouth County shore inventory sits in or near FEMA-designated Special Flood Hazard Areas. Sea Bright, parts of Long Branch, Belmar, and the bayside edges of Middletown carry flood designations that drive insurance premiums and, in some cases, mandatory elevation. Per current FEMA flood map (fema.gov/flood-maps) data and the New Jersey Department of Environmental Protection (NJDEP) flood mapper, buyers should pull the actual flood zone designation, base flood elevation, and elevation certificate before writing any offer on a shore property.
National Flood Insurance Program (NFIP) reform under Risk Rating 2.0 has reshaped premium math, and private flood markets now compete on many Monmouth County shore addresses. Premiums on a Sea Bright single-family in an AE zone can run $2,400 to $6,500 a year depending on elevation, finished basement status, and prior claim history. Our buying a home in a flood zone guide for NYC and NJ buyers walks the full diligence checklist.
NJ Transit and the Commute to NYC From Monmouth County
The North Jersey Coast Line is the spine of Monmouth County’s NYC commute pattern. NJ Transit’s NJCL runs from Bay Head through Spring Lake, Belmar, Asbury Park, Long Branch, Little Silver, Red Bank, Middletown, Hazlet, Matawan, and Aberdeen, then continues north to Newark Penn and New York Penn Station. Off-peak Red Bank to NYC Penn runs about 70 to 80 minutes. Peak service in either direction typically lands at 65 to 78 minutes from Red Bank, slightly longer from Long Branch or Belmar.
For buyers moving from the five boroughs, the relocation math is the first conversation our team has. Our relocating from NYC to NJ moving guide lines up commute, tax, and lifestyle tradeoffs side by side. For investors weighing the area, the New Jersey investment towns roundup covers cap rates and rent comps in commute-rich townships.
Monmouth County Property Taxes in 2026
Property taxes carry weight in any Monmouth County NJ housing market conversation. Per state Treasury data, the 2025 average effective property tax rate across Monmouth County sat at roughly 1.95% of assessed value, with town millage ranging from about 1.55% in Spring Lake to over 2.65% in towns with smaller commercial tax bases. On a $745,000 county-median home with a 1.95% effective rate, annual property taxes run near $14,500. On a $1.05 million Holmdel home, the bill clears $20,000. On a $495,000 Aberdeen home, the bill is closer to $9,650.
For buyers comparing across the river, the NJ property tax vs NY comparison calculator lays out the side-by-side. The short read is that NJ taxes are higher than NY in absolute dollars but often net favorable once income tax, sales tax, and commute cost are factored in.
Who Is Buying Monmouth County Homes Right Now
Three buyer cohorts drive the Monmouth County NJ housing market in 2026. First, NYC transferees from Manhattan, Brooklyn, and lower Hudson County, often dual-income households with a remote-flex schedule looking for shore towns or NJ Transit commuter towns. Second, upgrade buyers already inside the county, often Middletown or Marlboro families stepping into Holmdel or Fair Haven. Third, downsizers from larger inland houses moving into Red Bank, Long Branch, or Spring Lake condos and townhomes, or into one of the 55 plus communities in NJ. Each cohort has a different offer profile and a different sensitivity to rate moves. Working with a local team that knows the cohort lines matters more in 2026 than in any year we have seen.
For first-time buyers structuring a clean offer, the making an offer on a house in NY and NJ guide walks the contingencies, deposit, and timeline conventions that close deals in Monmouth.
Summer 2026 Monmouth County Housing Market Forecast
Three things are likely as summer 2026 lands. First, inventory will keep nudging higher into July as sellers who waited for a spring read finally list. Expect active listings to push toward 1,300 by late July. Second, days on market should stay near current levels or shorten slightly, because the post-Memorial Day buyer wave is the deepest of the year along the shore. Third, median price will likely hold or print one more incremental gain into July before flattening into August. If the Federal Reserve signals a rate cut in late summer, buyer demand will respond fast, and any softening visible in May 2026 inventory will compress again. Our base case is a flat-to-up summer, with most of the action happening in the under-$900,000 family-town band.
Is Monmouth County a Buyer’s Market or Seller’s Market in 2026?
Months of supply at 3.1 still tilts the Monmouth County NJ housing market toward sellers, but the tilt is the mildest it has been since 2020. A balanced market sits around 5 to 6 months. Sellers still set the floor, especially in Holmdel, Marlboro, Wall, and Middletown where days on market runs under 31. Buyers have more room to ask for inspections, repair credits, and reasonable contingency timelines than they did 18 months ago. Move-in-ready homes priced inside the comp range still see multiple offers. Over-priced homes sit. The honest read is that 2026 is a seller’s market by definition, but it behaves like a balanced market in many price bands.
How to Position a Listing or an Offer This Season
For sellers, three moves matter most. Price inside the comp range, not above it. Stage the kitchen and primary bath because those two rooms drive close to half the buyer pre-tour filtering. Photograph at the right time of day for shore listings, because beach-block light sells. For buyers, pre-approval at full strength is now table stakes, not a differentiator. Inspection contingencies are back on most deals, but appraisal contingencies still get waived on under-$900,000 family-town offers where comps are clean. Earnest money in Monmouth County typically runs 5% of purchase price. Closing timelines on conventional financing run 35 to 45 days, faster on cash. The closing process guide for NY and NJ buyers and the property lines guide for NY and NJ cover the diligence pieces most buyers miss.
Ready for a number on your home? Request a free home valuation from Robert DeFalco Realty, and a local agent will return a price opinion grounded in May 2026 closed comps within five business days. Buying? Schedule a buyer consultation, and we will walk you through pre-approval, target towns, and offer strategy without pressure. Out-of-state buyer? The how to buy a home in NY complete guide and the buyer’s agent NY and NJ guide pair well with this market read.
Frequently Asked Questions
What is the median home price in Monmouth County 2026?
The Monmouth County NJ housing market posted a county-wide median single-family sale price of $745,000 in May 2026, up 4.2% from $715,000 in May 2025. The median condo and townhouse price was $395,000.
Is Monmouth County a buyer’s or seller’s market in 2026?
Monmouth County is still a seller’s market in May 2026 with 3.1 months of supply, but behavior is softer than 2022 to 2023. Buyers can negotiate inspection credits and reasonable contingencies in most price bands, and overpriced homes now sit.
How fast are Monmouth County homes selling?
Median days on market across the county is 37 days as of May 2026. Family towns like Holmdel, Marlboro, Manalapan, Wall, and Middletown move faster, often closing in 26 to 31 days. Sale-to-list ratio is 99.4% county-wide.
Which Monmouth County town has the highest home prices?
Rumson posts the highest median sale price at $2.4 million in May 2026, followed by Spring Lake at $2.1 million, Colts Neck at $1.85 million, and Sea Bright at $1.55 million.
Are Monmouth County shore towns more expensive than inland?
At the top end yes, with Spring Lake and Sea Bright leading shore pricing well above $1.5 million. At the entry level shore towns like Long Branch ($625K) and Asbury Park ($725K) actually price below several inland family towns, so the answer depends on price band.
What is the commute time from Monmouth County to NYC?
Peak NJ Transit North Jersey Coast Line service from Red Bank to New York Penn Station runs 65 to 78 minutes. From Long Branch the trip is typically 75 to 90 minutes. The NJCL is the primary commute backbone for the county.
How are Monmouth County property taxes?
The 2025 average effective property tax rate across Monmouth County was roughly 1.95% of assessed value. On the $745,000 county-median home, that runs about $14,500 a year. Rates vary by town, with Spring Lake among the lowest and several inland townships running over 2.5%.
Is Monmouth County a good place to live in 2026?
For NYC commuters wanting beach access, top-ranked school districts (Holmdel, Rumson-Fair Haven, Marlboro, Manalapan), and direct NJ Transit service, Monmouth County remains one of the strongest residential markets in the tri-state region. Higher property taxes are the main tradeoff buyers weigh.
Robert DeFalco founded Robert DeFalco Realty in 1987. Nearly four decades later, the firm is one of the most recognized residential brokerages serving Staten Island, Brooklyn, and New Jersey, with a focus on full-service representation for buyers and sellers.