
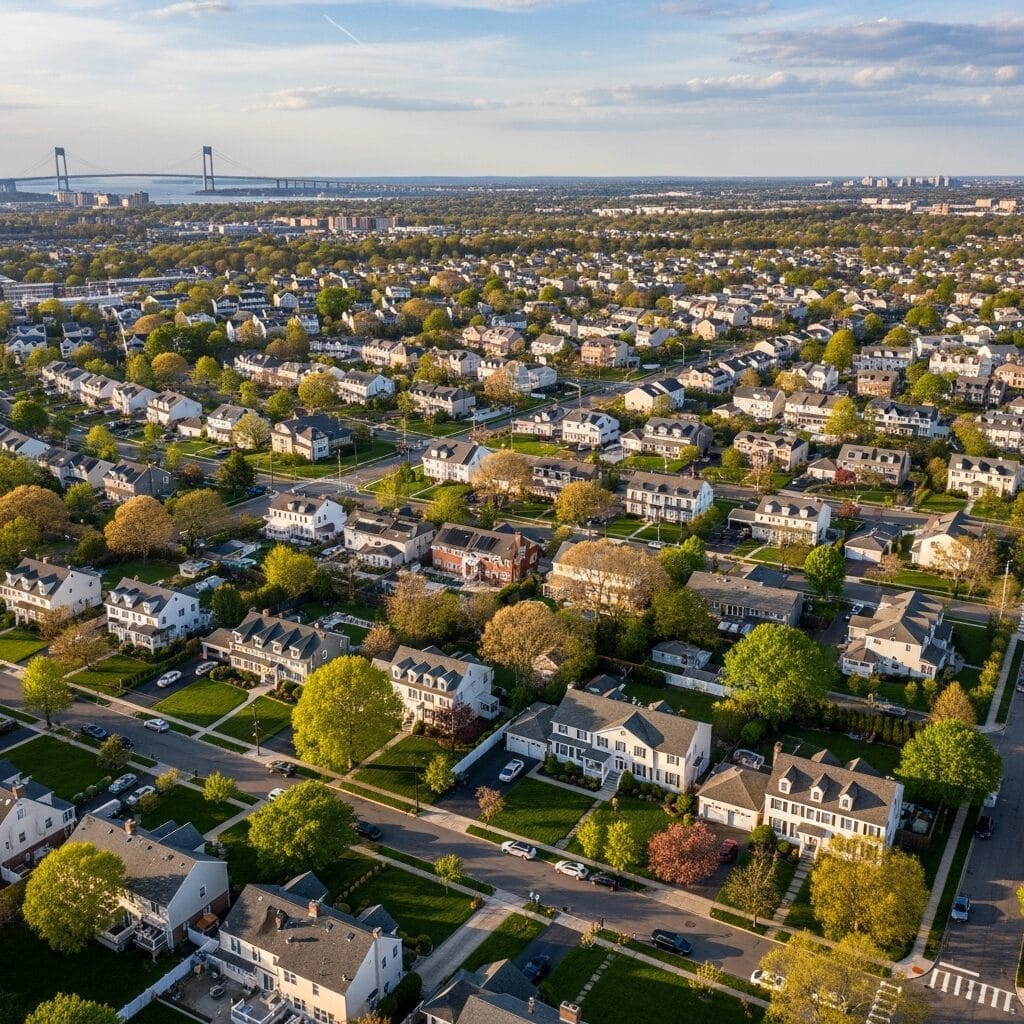
The Staten Island real estate market in May 2026 is holding the seller-leaning posture it has carried through the spring buying season, with median single-family prices climbing to roughly $795,000 and homes finding contracts in about 41 days on average. Inventory is up modestly from the early-spring trough, mortgage rates have settled into the mid-6 percent range, and pending sales are running ahead of last year. If you are tracking Staten Island home prices May 2026 because you are buying, selling, or simply watching the borough, this report walks through every metric that matters and what each number means for the decision in front of you.
Robert DeFalco Realty has tracked Staten Island monthly since 1987, and the team builds these recurring reports from OneKey MLS data, SIBOR figures, and on-the-ground conversations with buyers, sellers, and lenders across the borough. The numbers below are pulled from May 2026 closings and active listings, with April 2026 and May 2025 used as the comparison baselines.
Ready for a personal read on what your home is worth in this market? Request a free home valuation and get a Staten Island agent on the phone within one business day.
In This Post
Staten Island Real Estate Market May 2026 at a Glance
Headline numbers for May 2026
Here is what the May 2026 Staten Island market looks like in one snapshot:
- Median single-family sale price: $795,000
- Median two-family sale price: $895,000
- Median condo and co-op sale price: $425,000
- Average days on market: 41
- Months of supply: 3.4
- Active listings borough-wide: 762
- Pending sales: 327
- Sale-to-list price ratio: 99.1 percent
- Average 30-year fixed mortgage rate: 6.52 percent
Single-family detached homes still drive the bulk of Staten Island closings, and the median for that category is up about 3.9 percent year over year from May 2025’s $765,000 reading. Two-family homes, a Staten Island staple thanks to the borough’s deep stock of brick semi-attached duplexes, pulled a $895,000 median, which is one of the strongest readings the segment has posted since the 2022 peak.
How May 2026 compares to April 2026
Month over month, the borough picked up a touch of steam. The April 2026 Staten Island report we published last month showed a median single-family price near $785,000, days on market around 44, and months of supply close to 3.6. The May read lifts price by roughly 1.3 percent, trims days on market by three days, and tightens supply by two-tenths of a month. Those are not seismic shifts, but they are the textbook signature of a healthy spring buying season working through the borough.
The other piece of the April-to-May story is contract activity. Pending sales rose from 308 in April to 327 in May, an increase of about 6 percent. That tells us buyers who had been waiting for clarity on rates and inventory finally stepped off the sidelines.
How May 2026 compares to May 2025
Year over year is where the story gets more interesting. In May 2025, Staten Island posted a median single-family of about $765,000, days on market near 47, and months of supply around 4.1. The borough has tightened on every front since:
- Median price: up 3.9 percent
- Days on market: down 6 days, about 13 percent faster
- Months of supply: down 0.7 months, about 17 percent tighter
- Active listings: roughly flat
- Pending sales: up about 8 percent
Prices climbing while supply tightens and homes sell faster is the classic seller-leaning pattern. The borough has not flipped into a runaway market, but it is firmer than it was a year ago.
Staten Island Home Prices May 2026 by Property Type
Staten Island is not one market. The borough’s price story changes meaningfully depending on whether you are looking at a single-family detached colonial in Annadale, a brick semi-attached two-family in New Springville, or a low-rise condo near the ferry. Here is how each segment closed May 2026.
Single-family home prices
The single-family median sat at $795,000 in May, with median price per square foot at $432. The mid-band of closings (the 25th to 75th percentile) ran from about $640,000 to $985,000. Above $1.2 million the market is thinner and more negotiated, while the heart of activity is the $650,000 to $900,000 corridor where mid-tier South Shore and Mid-Island stock dominates.
Detached homes in good school zones and on quiet blocks continue to draw multiple offers. Homes that need work or sit on busy through-streets are sitting longer and trimming list prices by 2 to 4 percent before going under contract.
Two-family home prices
Two-family closings posted a $895,000 median, with the 25th to 75th percentile band running from $785,000 to $1,025,000. Per-square-foot pricing on two-family product came in around $385. Investors and owner-occupants who use the rental unit to offset the mortgage are still the dominant buyer pool, and demand for legal two-families with separate utilities remains strong.
If you own a two-family and have been weighing a sale, May is one of the stronger months we have seen for the segment in two years. The combination of resilient rents on the borough and a tighter listing pool is supporting the price.
Condo and co-op prices
Staten Island condos and co-ops are a smaller slice of the market, but they matter for first-time buyers, downsizers, and investors. The May 2026 median sat at $425,000, with North Shore and Mid-Island product driving most of the volume. Days on market for condos ran a touch longer than for houses, averaging 48 days, which reflects the smaller buyer pool for attached product and the influence of building financials on financing approvals.
For a deeper look at how prices have moved across property types, see our Staten Island home value guide.
Staten Island Housing Inventory and Months of Supply
Active listings borough-wide
Active inventory climbed to 762 listings borough-wide in May 2026, up from 712 in April. Spring sellers brought new product to market, which is the expected seasonal pattern. Year over year, active listings are running flat to slightly down, so the inventory rebuild is happening, but slowly.
Pending sales and absorption
Pending sales hit 327, the strongest May number we have logged in two years. Absorption (pendings divided by actives) is running at about 43 percent, which signals buyers are pulling new listings into contract at a healthy clip.
What months of supply means for May 2026
Months of supply is the cleanest single-number read on market balance. It tells you how long, at the current pace of sales, it would take to sell every active listing if no new homes hit the market. At 3.4 months of supply in May 2026, Staten Island sits in seller territory. The standard frame, which we walk through in our months of supply explained guide, reads roughly like this:
- Under 4 months: seller’s market
- 4 to 6 months: balanced market
- Over 6 months: buyer’s market
Staten Island has been below 4 months every month since the start of 2025, so the seller-leaning balance is durable, not a one-month anomaly.
Staten Island Days on Market and Sale-to-List Ratio
How fast Staten Island homes are selling
Average days on market dropped to 41 in May 2026, down from 44 in April and 47 in May 2025. Median DOM is shorter at 32 days, which is the better number to anchor on if you are pricing a home, because medians strip out the long-tail of distressed and overpriced listings.
By property type:
- Single-family DOM: 38 days
- Two-family DOM: 42 days
- Condo and co-op DOM: 48 days
Homes priced inside the comp range are routinely going to contract inside two weeks. Listings priced 5 percent or more above comps are taking 60-plus days and almost always need a price cut before they close.
Sale-to-list price trends
The borough-wide sale-to-list ratio sat at 99.1 percent in May. That means the average closed price came in within about 1 percent of the final list price, with a healthy share of homes (about 28 percent of closings) trading above ask. Bidding wars are not the default, but they are common in the $650,000 to $900,000 single-family band on the South Shore and Mid-Island.
Thinking about selling this summer? Schedule a buyer consultation or seller strategy call with a DeFalco agent and we will pull live comps for your block.
Mortgage Rates and Buying Power in May 2026
Where the 30-year fixed rate sits
Freddie Mac’s Primary Mortgage Market Survey put the 30-year fixed at 6.52 percent in the third week of May 2026, with a tight range across the month of 6.42 to 6.61 percent. Fifteen-year fixed product ran about 75 basis points lower at 5.78 percent. Jumbo product, which matters for higher-end Staten Island closings, ran roughly 15 to 25 basis points above the conforming 30-year.
For the long-running rate picture and how policy is feeding into the housing market, our tariffs, Fed cuts, and mortgage rates explainer walks through the macro frame.
Fed policy context for spring 2026
The Federal Reserve held rates steady at its May 2026 FOMC meeting, signaling patience while inflation data lands. Markets are pricing in two more cuts before year-end, which has nudged mortgage-backed securities pricing in a slightly buyer-friendly direction. Mortgage rates are not the Fed funds rate, but the policy signal does feed through to the long end of the curve, and we have seen Staten Island lock activity tick up whenever the 30-year prints below 6.5 percent.
Payment math at current rates
A $795,000 Staten Island single-family with 20 percent down ($636,000 financed) at 6.52 percent on a 30-year fixed pencils to about $4,030 per month in principal and interest. Add Staten Island property taxes (roughly $7,800 a year on a median home) and homeowner’s insurance, and the all-in monthly housing payment lands close to $4,850. Buyers who can put 25 percent or 30 percent down are pulling that monthly payment under $4,500.
For first-time buyers running these numbers for the first time, the how to buy a home in NY complete guide walks through the financing, inspection, and closing steps.
Staten Island Neighborhood Market Breakdown May 2026
Staten Island’s market splits cleanly into three geographic bands. Here is where each major neighborhood stands in May 2026.
South Shore neighborhoods
The South Shore is the borough’s largest pool of single-family closings and pulled the strongest May numbers.
| Neighborhood | Median SF Price May 2026 | Avg DOM | YoY Price Change |
|---|---|---|---|
| Tottenville | $875,000 | 35 | +4.5% |
| Annadale | $945,000 | 32 | +5.1% |
| Eltingville | $785,000 | 38 | +3.8% |
| Great Kills | $735,000 | 41 | +3.2% |
| Huguenot | $850,000 | 36 | +4.0% |
| Prince’s Bay | $810,000 | 39 | +3.6% |
| Rossville | $725,000 | 43 | +2.9% |
Annadale led the South Shore on year-over-year price growth, and our Annadale Staten Island neighborhood guide walks through why families keep choosing the area. Tottenville continues to draw buyers looking for the borough’s southernmost mix of waterfront and single-family detached stock, covered in detail in the Tottenville Staten Island guide. Eltingville pricing held its mid-South-Shore range, which the Eltingville Staten Island guide breaks down further. Great Kills, profiled in our Great Kills Staten Island guide, keeps offering some of the South Shore’s better entry points for buyers.
Mid-Island neighborhoods
Mid-Island is where the borough’s two-family stock concentrates and where many first-time owner-occupant investors find their first deal.
| Neighborhood | Median SF Price May 2026 | Avg DOM | YoY Price Change |
|---|---|---|---|
| New Springville | $755,000 | 40 | +3.5% |
| Westerleigh | $815,000 | 37 | +4.2% |
| Todt Hill | $1,650,000 | 58 | +2.1% |
| New Dorp | $695,000 | 42 | +3.1% |
| Bay Terrace | $740,000 | 39 | +3.4% |
Todt Hill remains the borough’s luxury anchor. Days on market run longer at the top, which is normal for high-priced product, and price appreciation is steadier rather than fast. Westerleigh keeps drawing buyers looking for older charm on tree-lined blocks, and New Springville is the volume center for two-family closings.
North Shore neighborhoods
The North Shore is the most diverse slice of the borough by price, with St George condo product on one end and historic single-family pockets in Stapleton and Port Richmond on the other.
| Neighborhood | Median Price May 2026 | Avg DOM | YoY Price Change |
|---|---|---|---|
| St George (condo-heavy) | $485,000 | 49 | +2.6% |
| Stapleton | $645,000 | 45 | +3.0% |
| Port Richmond | $585,000 | 47 | +2.8% |
| Midland Beach | $625,000 | 44 | +3.1% |
The North Shore’s value pitch remains strong for buyers priced out of South Shore single-family. Stapleton in particular has drawn attention from buyers who would have looked at parts of Brooklyn three years ago.
Is the Staten Island Market a Buyer’s Market or Seller’s Market in May 2026?
This is the question we get every week. The short answer for May 2026: Staten Island is a seller’s market, but a measured one, not a runaway one.
Signals favoring sellers
- Months of supply at 3.4, well under the 4-month balanced threshold
- Days on market at 41, faster than May 2025
- Sale-to-list ratio at 99.1 percent
- Year-over-year price growth of 3.9 percent on single-family
- Pending sales running ahead of last year
Signals favoring buyers
- Active inventory up from April, giving buyers more choice
- Mortgage rates trending sideways rather than spiking
- Overpriced listings are sitting and cutting, which means patient buyers can negotiate
- Roughly 28 percent of closings come in at or above ask, which still leaves 72 percent trading at or below list
If you are buying, the takeaway is that you have more selection than you had in March, but well-priced homes in good zones still need decisive offers. If you are selling, pricing inside the comp band almost guarantees a contract inside 30 to 45 days.
For a longer view of borough conditions, the Staten Island real estate market update goes deeper than this monthly snapshot.
What to Expect for Staten Island Real Estate Through Summer 2026
Price forecast through August 2026
Spring price gains usually carry into June and early July before flattening through August. We expect the median single-family to print in the $800,000 to $815,000 range through July, with August often softening as transaction volume cools. Two-family medians should hold near the $895,000 to $920,000 band, and condo medians should stay close to $425,000.
Inventory forecast
New listings tend to peak in May and early June, then taper. Active inventory will likely climb modestly through June (potentially to 800-plus listings) before falling back through August as the listings that have been sitting either contract or come off the market. Months of supply should hover near 3.3 to 3.7 through the summer, keeping the borough in seller-leaning territory.
Mortgage rate direction is the wild card. If Freddie Mac’s 30-year prints under 6.25 percent at any point this summer, expect a fresh wave of buyer demand that would tighten the market further. If rates push back over 6.75 percent, expect days on market to lengthen and sale-to-list to dip toward 98 percent.
Advice for Staten Island Buyers in May 2026
If you are buying on Staten Island this month, here is the playbook.
- Get fully underwritten before you tour. A pre-approval letter is no longer enough on contested listings. A lender who can issue a fully underwritten approval gives your offer credibility.
- Tour quickly. Homes priced in the comp band are getting offers inside 7 days. Saturday open-house-only buyers are missing the contract window.
- Bring an inspection contingency, but be ready to limit it. Strong offers in May 2026 are using shorter inspection windows (5 to 7 business days) and walking in with a clear sense of what they will and will not negotiate.
- Budget realistically. The principal-and-interest payment at 6.52 percent is the headline, but Staten Island property taxes, homeowner’s insurance (especially in flood-zone-adjacent pockets), and any HOA dues add real monthly carry.
- Use a buyer’s agent. Our buyer’s agent NY NJ guide walks through how representation works under the current commission rules.
If you are an investor evaluating Staten Island two-family product, also read our mother-in-law suite NY NJ guide for accessory-unit rules and zoning context.
Want a buyer game plan customized for your budget and target neighborhoods? Schedule a buyer consultation with a Staten Island specialist.
Advice for Staten Island Sellers in May 2026
If you are selling, May and June are your prime windows.
- Price inside the comp band. The temptation to price 5 percent over comps and “see what happens” backfires. Listings that need a cut take 60-plus days and almost always close below where they would have if priced right on day one.
- Get the prep work done before listing. Paint, declutter, and stage. Staten Island buyers walk through a lot of homes in May, and the ones that show best win the offer race.
- Time your photos for spring light. Lawns are green, gardens are filling in. Listings that go live with March-shot photos in May look stale.
- Understand the tax math. Our Staten Island sellers tax guide covers NYC transfer tax, NY State transfer tax, and capital gains considerations.
- Plan your next move. If you are selling and buying, talk to your agent about contingencies and bridge financing before you list.
For a wider regional view, the NY NJ real estate market statistics page shows how Staten Island stacks against the surrounding tri-state market.
Frequently Asked Questions About the Staten Island Market May 2026
What is the median home price in Staten Island May 2026?
The median single-family sale price in Staten Island for May 2026 is $795,000. The median two-family price is $895,000, and the median condo and co-op price is $425,000. Year over year, single-family prices are up about 3.9 percent.
Is Staten Island a buyer’s or seller’s market in 2026?
Staten Island is a seller’s market in May 2026. Months of supply sits at 3.4, well below the 4-month threshold that separates a seller’s market from a balanced one. Homes are selling faster than last year and at 99.1 percent of list price on average.
How fast are Staten Island homes selling?
The average days on market in May 2026 is 41 days. Median days on market is 32 days. Single-family homes are selling in about 38 days, two-family in 42 days, and condos in 48 days.
What are mortgage rates in May 2026?
The 30-year fixed mortgage rate averaged 6.52 percent in May 2026 according to Freddie Mac’s Primary Mortgage Market Survey, with a monthly range of 6.42 to 6.61 percent. The 15-year fixed averaged 5.78 percent.
Which Staten Island neighborhood saw the biggest price growth?
Annadale led Staten Island on year-over-year price growth in May 2026, up 5.1 percent to a $945,000 median single-family sale price. Tottenville and Huguenot followed with growth of 4.5 and 4.0 percent.
Is Staten Island affordable compared to Brooklyn?
Yes. Staten Island’s median single-family price of $795,000 is well below Brooklyn’s comparable single-family medians, and the borough offers more detached homes with yards and parking. Buyers priced out of Brooklyn brownstone neighborhoods often find Staten Island competitive on price and property type.
When is the best time to sell in Staten Island?
Late spring and early summer (May through June) are historically the strongest months for Staten Island sellers. Inventory is higher but buyer activity is also at its peak, which keeps days on market low and sale-to-list ratios high.
Are Staten Island home prices going up or down in 2026?
Staten Island home prices are up about 3.9 percent year over year as of May 2026, with month-over-month gains of roughly 1.3 percent from April. Prices have risen every month so far in 2026.
Robert DeFalco founded Robert DeFalco Realty in 1987, and the team has built Staten Island market reports every month since the early days of the borough’s modern MLS era. Get in touch any time you want a live read on your block.