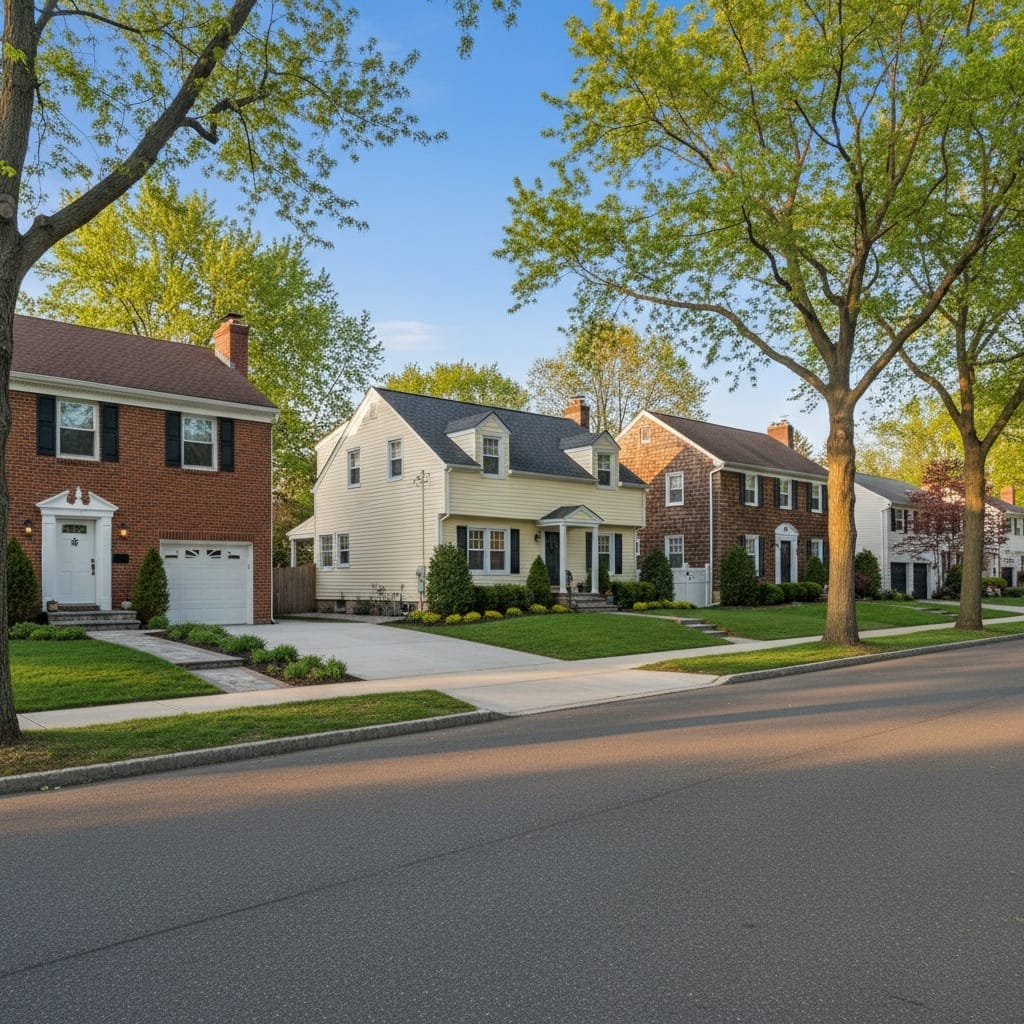
Staten Island home value represents the current market price a qualified buyer pays for residential property in Staten Island, New York (Richmond County). Understanding Staten Island home values requires analyzing comparable sales data, neighborhood-specific factors, property conditions, and local market dynamics including flood zone designations and commute infrastructure.
As of August 2025, Staten Island’s median house sale price is $757,000 (8.2% increase year-over-year). The typical Staten Island home value stands at $703,176 (3.6% annual growth), with properties selling in approximately 41 days on average. Price per square foot ranges from $430 to $482 depending on neighborhood location.
What Determines Staten Island Home Value in 2025
Staten Island home value depends on six primary factors: location within specific micro-markets (North Shore, South Shore, Mid-Island, East Shore, West Shore), property type (detached, semi-attached, townhouse, condominium), physical characteristics (square footage, bedrooms, bathrooms, lot size), condition and renovation quality, market timing, and environmental considerations (flood zones, commute access).
Market Value vs Assessed Value vs Appraisal: NYC Property Valuation Methods
Market value equals the price negotiated between willing buyers and sellers in current conditions, determined through comparative market analysis of recent sales.
Assessed value is assigned by the NYC Department of Finance exclusively for property taxation purposes. NYC assessed values differ substantially from market values due to property class caps, transitional assessment calculations, and annual value freezes affecting Class 1 residential properties.
Appraisal provides a licensed appraiser’s opinion of value, typically commissioned by mortgage lenders to verify property values support loan amounts. Appraisals employ standardized methodologies: sales comparison approach, cost approach, and income capitalization approach.
Online Valuation Tools vs Professional CMA vs Licensed Appraisal
Automated Valuation Models (AVMs) including Zillow’s Zestimate process public records, tax assessments, and MLS data through algorithmic models. Zestimate median error rates range from 1.9% for on-market homes to 6.9% for off-market properties. AVMs cannot account for renovation quality, legal basement status, parking configurations, or flood insurance requirements.
Comparative Market Analysis (CMA) delivered by licensed real estate agents utilizes Staten Island Multiple Listing Service (SIMLS) proprietary data, in-person property inspections, and micro-market expertise covering specific school zones, street-by-street characteristics, and buyer demand patterns. Professional CMAs provide the most accurate pre-listing valuations.
Licensed appraisals follow Uniform Standards of Professional Appraisal Practice (USPAP) guidelines, required by mortgage lenders for purchase financing and refinancing transactions.
How to Calculate Staten Island Home Value Using Comparable Sales
Calculating accurate Staten Island home values requires systematic comparable sales analysis following these steps:
Step 1: Define Comparable Property Parameters
Geographic radius: Begin with 0.25-0.5 mile radius in densely populated neighborhoods (St. George, New Dorp, Great Kills). Expand to 0.5-1.0 mile radius in areas with limited inventory (Lighthouse Hill, Tottenville, Prince’s Bay).
Time frame: Prioritize sales closed within 90-180 days to reflect current market conditions, interest rate environments, and seasonal demand fluctuations.
Property matching criteria: Select identical property types (detached single-family, semi-detached, townhouse, condominium), similar construction dates (±15 years), comparable square footage (±20%), equivalent lot sizes, and matching bedroom/bathroom counts.
Step 2: Gather Recent Sales Data
Access NYC Department of Finance Rolling Sales database to verify actual closing prices, sale dates, and deed transfer information. Cross-reference MLS listings on Redfin, Realtor.com, and Zillow to examine property photographs, listed features, and days on market data.
Step 3: Apply Market-Based Adjustments
Bedroom/bathroom adjustments: Additional legal bedrooms add $15,000-$35,000 per bedroom in Staten Island. Full bathrooms contribute $8,000-$20,000 value increases depending on neighborhood.
Square footage normalization: Calculate price per square foot for each comparable sale. Staten Island’s median PPSF is $430-$482 (September 2025). Apply PPSF to subject property’s square footage, recognizing PPSF decreases as total square footage increases.
Condition and renovation premiums: Updated kitchens add 3-7% value. Renovated bathrooms contribute 2-5% increases. New roofs, HVAC systems, windows provide 1-4% value improvements. Finished basements (legal, permitted) add $25,000-$75,000 depending on size and quality.
Parking and garage value: Off-street parking adds $10,000-$25,000. Attached garages contribute $20,000-$40,000 premiums in areas with limited street parking.
Flood zone impact: Properties located in FEMA Special Flood Hazard Areas (AE, VE zones) experience 3-8% value reductions due to mandatory flood insurance requirements averaging $1,200-$3,500 annually.
Step 4: Weight Comparable Sales by Relevance
Assign highest weight to most similar properties (90-100% similarity scores), recent sales (last 60 days), and closest geographic proximity (same neighborhood subdivision). Discount outlier transactions including estate sales, short sales, foreclosures, and extensively renovated properties unless subject property matches these characteristics.
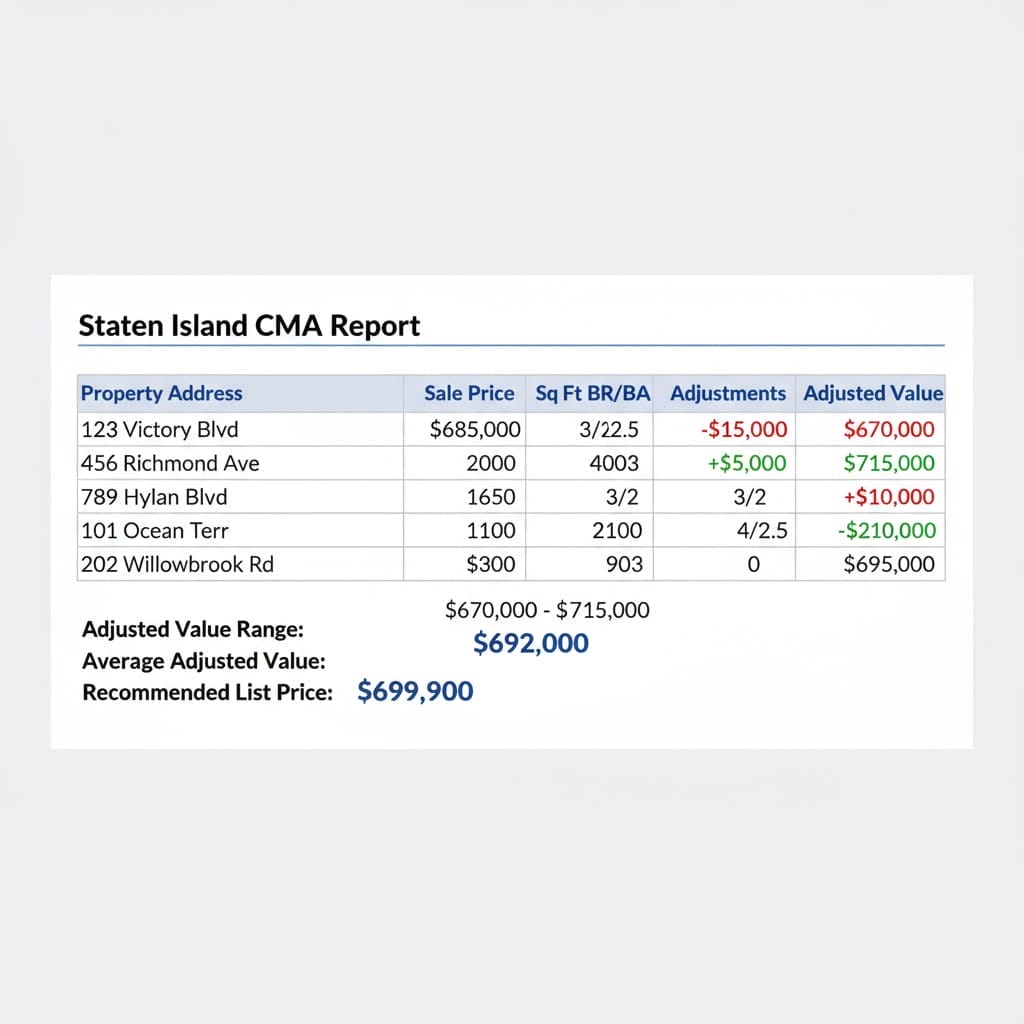
Step 5: Reconcile Adjusted Values into Price Range
Compile adjusted sale prices to establish probable value range. Select list price considering seller timeline urgency (quick sale vs. maximum price), current market velocity (days on market trends), and competitive inventory levels.
Need professional comparable sales analysis? Request a free Staten Island CMA from licensed local agents with SIMLS access. Browse current homes for sale in Staten Island to see active market inventory.
Staten Island Neighborhood Home Values: Geographic Price Variations
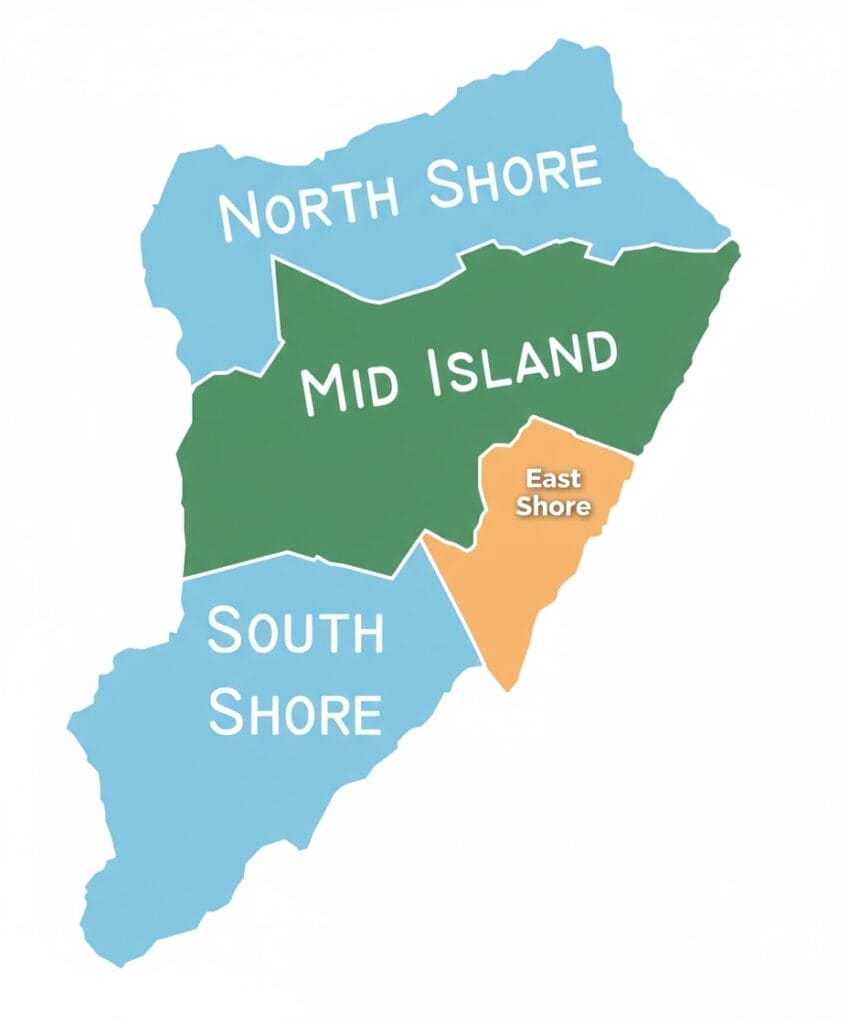
Staten Island home values vary significantly across five geographic regions, each with distinct price points, property types, and buyer demographics.
North Shore Home Values: St. George, Tompkinsville, Stapleton, West Brighton
North Shore neighborhoods offer Staten Island’s most direct Manhattan access via Staten Island Ferry (25-minute crossing to Financial District). St. George features mixed-use development with waterfront condominiums ($450,000-$750,000), historic brownstones ($600,000-$900,000), and renovation projects.
Tompkinsville and Stapleton attract young professionals seeking walkable neighborhoods with restaurants, cafes, and cultural venues. Median home values: $550,000-$750,000 for townhouses and renovated single-families.
West Brighton provides more affordable entry points ($475,000-$625,000) with access to Clove Lakes Park and Silver Lake Park.
Mid-Island Home Values: New Springville, Willowbrook, Bulls Head, Heartland Village
Mid-Island neighborhoods deliver suburban family living with proximity to Staten Island Mall, transit hubs, and major roadways (Staten Island Expressway, Victory Boulevard, Richmond Avenue).
New Springville: Median home value $533,700. Mix of semi-attached homes, garden apartments, and newer construction townhouses.
Willowbrook: Median home value $681,745. Detached single-families on larger lots, strong school districts.
Bulls Head: Median home value $687,150. Established neighborhood with mix of attached and detached properties.
Heartland Village/Greenridge: Median home value $726,926. Newer development with modern amenities, community facilities.
South Shore Home Values: Great Kills, Tottenville, Huguenot, Prince’s Bay, Eltingville
South Shore represents Staten Island’s highest median home values, characterized by larger lot sizes (0.15-0.25+ acres), predominantly detached construction, superior school ratings, and waterfront access.
Tottenville: Southernmost neighborhood with median values $725,000-$950,000. Beach access, Conference House Park, lower population density.
Great Kills: Strong family market with median values $700,000-$875,000. Great Kills Park, marina access, established communities.
Huguenot/Prince’s Bay: Premium waterfront properties $850,000-$1,200,000+. Larger estates, rural character, conservation areas.
East Shore Home Values: New Dorp, Oakwood, South Beach, Midland Beach
East Shore neighborhoods provide beach proximity, Verrazzano-Narrows Bridge access (Brooklyn connection), and diverse housing stock.
New Dorp: Commercial corridor with residential side streets. Median values $650,000-$800,000.
Oakwood: Beach community with median values $700,000-$850,000. Mix of bungalows, Cape Cods, contemporary construction.
South Beach/Midland Beach: Oceanfront location with median values $575,000-$775,000. Seasonal tourism influence, flood zone considerations.
West Shore Home Values: Port Richmond, Mariners Harbor, Industrial Areas
West Shore features more industrial land use, limited residential development, and lower median home values ($425,000-$575,000). Working-class neighborhoods with smaller lot sizes and older housing stock.
Critical Location Factors Affecting Staten Island Home Values
Commute infrastructure: Staten Island Ferry access (free service), express bus routes (X1, X10, X17 to Manhattan), Verrazzano-Narrows Bridge toll ($13.12 E-ZPass), Staten Island Railway stations.
School quality: New York City Department of Education district zoning significantly impacts home values. Top-rated elementary/intermediate/high schools command 8-15% premiums.
Parks and recreation: Properties within 0.25 miles of Greenbelt trails, Conference House Park, Great Kills Park, or Clove Lakes Park demonstrate 3-7% value increases.
Retail proximity: Access to Staten Island Mall, shopping corridors (Forest Avenue, Richmond Avenue, Hylan Boulevard) adds convenience value.
FEMA Flood Zone Impact on Staten Island Property Values

FEMA Flood Insurance Rate Maps designate flood risk zones affecting approximately 25% of Staten Island properties. Coastal neighborhoods (South Beach, Midland Beach, Great Kills, Tottenville) contain high concentrations of Special Flood Hazard Areas.
Zone AE (100-year floodplain): Mandatory flood insurance for mortgaged properties. Annual premiums $1,200-$2,500 for elevated structures, $2,500-$5,000+ for non-elevated basements.
Zone VE (coastal high hazard): Strictest building requirements, highest insurance costs ($3,500-$8,000+ annually). Properties experience 5-12% value reductions.
Flood mitigation measures: Elevated foundations, flood vents, waterproof materials, sump pumps, and backflow preventers reduce insurance premiums 15-30% and protect property values.
Staten Island Property Types and Feature Value Premiums
Detached Single-Family vs Semi-Attached vs Townhouse/Condominium Values
Detached single-family homes (53% of Staten Island housing stock) command highest values. Median price $757,000 (August 2025). Premium for privacy, larger lots (0.10-0.25 acres typical), expansion potential, no shared walls.
Semi-attached homes (23% of housing stock) offer affordability with median prices $625,000-$725,000. Efficient footprints, lower maintenance costs, but reduced privacy and limited yard space.
Townhouses provide modern amenities, community features, HOA management. Median prices $550,000-$750,000. HOA fees average $250-$450 monthly.
Condominiums deliver maintenance-free living with median prices $540,000 (37.1% year-over-year increase August 2025). Ideal for first-time buyers, downsizers, investors. Proximity to St. George Ferry, transit hubs drives demand.
High-Value Property Features in Staten Island Market
Lot dimensions and yard space: Properties on 50×100 foot lots (5,000 SF) represent baseline. Larger lots 60×120 (7,200 SF) or 75×150 (11,250 SF) add $35,000-$85,000 value. Corner lots with expanded side yards command additional 4-8% premiums.
Parking and garages: Driveway accommodating 2+ vehicles adds $15,000-$25,000. One-car attached garage contributes $25,000-$35,000. Two-car garage provides $40,000-$60,000 value increase.
Finished basements: Legal, permitted basement space (Certificate of Occupancy) with separate entrance, kitchen, bathroom adds $50,000-$100,000. Supports multigenerational living, rental income potential (subject to zoning).
Outdoor living spaces: Decks (12×16 typical) add $8,000-$15,000. Patios with pergolas contribute $10,000-$18,000. Swimming pools in South Shore properties add $25,000-$45,000 (maintenance considerations apply).
Staten Island Real Estate Market Timing and Pricing Strategy
Seasonal Market Patterns and Days on Market Analysis
Staten Island housing market demonstrates clear seasonality. Spring market (March-May) generates highest buyer activity, shortest days on market (35-45 days average), strongest competition, potential multiple-offer scenarios.
Summer market (June-August) maintains momentum with families relocating before school year. Current days on market: 41 days average (September 2025).
Fall market (September-November) slows gradually. Days on market extend to 50-65 days. Serious buyers remain active, less competition.
Winter market (December-February) experiences lowest activity. Days on market reach 70-90 days. Motivated sellers provide best negotiation opportunities for buyers.
Monitor real-time market data: Redfin Staten Island and Realtor.com Staten Island publish updated statistics including median sale prices, price per square foot, sale-to-list price ratios, and inventory levels.
List Price Optimization Strategies for Maximum Staten Island Home Value
At-market pricing: List within 2% of CMA-indicated value to attract serious buyers, facilitate appraisal approval, minimize days on market. Optimal for balanced market conditions.
Strategic underpricing: List 3-5% below market value to generate urgency, attract multiple showings first weekend, create competitive bidding environment. Most effective in high-demand neighborhoods (South Shore, premium Mid-Island) with limited inventory.
Premium pricing: List at or above CMA ceiling (top 5% of range) when property condition exceptional, unique features justify premium, or seller timeline flexible. Risk extended days on market, potential price reductions.
Price per square foot analysis essential. Compare PPSF within identical property types, same neighborhood subdivisions. Avoid generalizing Staten Island-wide averages ($430-$482 range) to specific micro-markets where PPSF varies ±15-25%.
Developing listing strategy? Consult with Staten Island selling specialists to optimize pricing approach, marketing plan, and negotiation tactics.
Increasing Staten Island Home Value: High-ROI Improvement Projects
Strategic home improvements generate measurable value increases. Focus investments on projects delivering 65-95% return on investment at sale.
Kitchen Renovations: 75-85% ROI
Minor kitchen updates ($15,000-$25,000): Cabinet refacing, new countertops (quartz/granite), updated appliances (stainless steel), modern lighting, backsplash. Returns $11,000-$21,000 at sale.
Major kitchen remodels ($40,000-$65,000): Complete cabinet replacement, luxury countertops, professional-grade appliances, expanded layouts, custom storage. Returns $30,000-$55,000 at sale.
Bathroom Renovations: 65-75% ROI
Primary bathroom updates ($12,000-$20,000): New vanity, modern fixtures, tiled shower, improved lighting, ventilation fan. Returns $8,000-$15,000.
Additional bathrooms ($20,000-$35,000): Converting half-bath to full bathroom, adding second floor bathroom. Returns $15,000-$26,000.
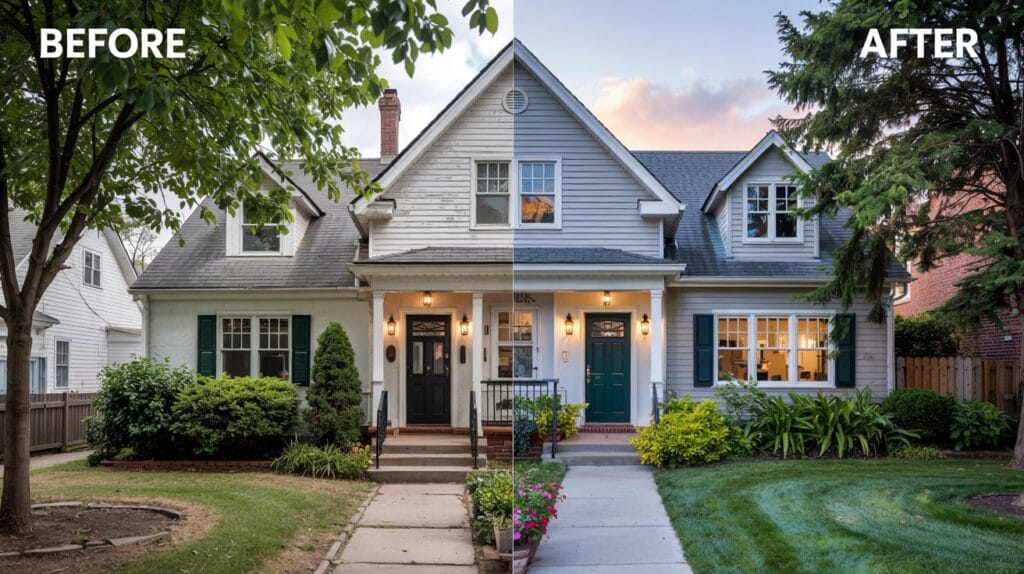
Curb Appeal Enhancements: 85-95% ROI
Exterior improvements ($5,000-$12,000): Professional landscaping, new entry door, exterior painting, power washing, modern light fixtures, mailbox replacement. Returns $4,500-$11,000.
Highest ROI home improvements combine aesthetic updates with functional benefits addressing Staten Island buyer preferences.
Energy Efficiency Upgrades: 70-80% ROI
HVAC replacement ($8,000-$15,000): High-efficiency furnace, central air conditioning, programmable thermostats. Returns $6,000-$12,000. Reduces operating costs $600-$1,200 annually.
Window replacement ($10,000-$20,000): Energy-efficient vinyl windows with Low-E glass. Returns $7,500-$16,000. Improves insulation, reduces heating/cooling costs.
Insulation improvements ($3,000-$7,000): Attic insulation (R-49 value), air sealing, basement insulation. Returns $2,500-$6,000.
Flood Resilience Improvements: Critical for Coastal Properties
Foundation elevation ($30,000-$100,000+): Raising structure above Base Flood Elevation. Required for substantial improvement projects in flood zones. Reduces insurance premiums 40-60%.
Flood vents installation ($1,500-$4,000): Engineered openings allowing floodwater flow, preventing structural damage. Reduces insurance premiums 10-20%.
Utilities elevation ($5,000-$15,000): Relocating HVAC, water heaters, electrical panels above flood level. Protects equipment, reduces claims history.
Landscaping and drainage ($3,000-$12,000): French drains, proper grading, rain gardens, permeable paving. Reduces flooding risk, improves property value 2-5% in flood-prone areas.
Permitting and Documentation Requirements
New York City Department of Buildings permits required for structural modifications, electrical work, plumbing alterations, HVAC installations. Unpermitted work creates title issues, appraisal challenges, potential violations.
Certificate of Occupancy updates necessary for finished basements, additional bathrooms, converted spaces. Lack of proper CO limits legal use, reduces market value.
Maintain organized records: permits, inspection certificates, contractor invoices, material warranties, before/after photographs. Documentation supports value claims during appraisal process.
Frequently Asked Questions: Staten Island Home Value, CMA, and Selling Process
How do I determine my Staten Island home value accurately?
Begin with automated valuation models (Zillow, Redfin, Realtor.com) for preliminary estimates. Request professional Comparative Market Analysis from licensed agent with SIMLS access for precise valuation. Verify recent sales using NYC DOF Rolling Sales public database.
Why does my NYC assessed value differ from Staten Island home value?
NYC Department of Finance assessed values serve taxation purposes exclusively. Class 1 residential properties limited to 6% annual increases, 20% five-year caps. Assessed values lag actual market values by 12-36 months due to assessment methodology, appeals processes, and statutory limitations.
Which provides better accuracy: Zestimate or agent CMA for Staten Island properties?
Professional CMAs deliver superior accuracy in Staten Island micro-markets. Zestimate median error rate 6.9% for off-market Staten Island properties versus 2-3% typical CMA variance. CMAs incorporate street-specific factors (flood zones, parking availability, school boundaries, renovation quality, legal basement status) unavailable to automated models.
Is September 2025 favorable for selling Staten Island homes?
September 2025 market conditions strong with 8.2% year-over-year house price appreciation, 41-day average days on market, and healthy buyer demand. Fall market offers motivated buyers (relocation deadlines, tax considerations) with reduced competition versus spring peak. Optimal for sellers with flexible timelines seeking qualified purchasers.
What differentiates appraisal from CMA in Staten Island real estate transactions?
Licensed appraisals follow USPAP standards, commissioned by mortgage lenders, provide legally defensible valuations for loan underwriting. CMAs prepared by real estate agents focus on marketability, competitive positioning, optimal pricing strategy. Both utilize comparable sales methodology but serve distinct purposes: lending compliance versus marketing strategy.
How long does Staten Island home sale process require from listing to closing?
Average timeline 75-120 days: Preparation/repairs (7-14 days), active marketing (30-50 days), offer negotiation (3-7 days), attorney review period (3-5 days), mortgage contingency (30-45 days), final walkthrough and closing (1-2 days). Cash transactions shorter (45-60 days). Delays occur with appraisal issues, title problems, or inspection negotiations.
What closing costs should Staten Island sellers expect?
Total seller closing costs typically 8-10% of sale price: Real estate commission (5-6%), New York State transfer tax (0.4% up to $3M), mansion tax if applicable (1%+ for $1M+ sales), NYC transfer tax (1% up to $500K, 1.425% above), attorney fees ($2,000-$4,000), title insurance, property tax prorations, HOA fees, outstanding liens/judgments, home warranty (optional $400-$800).
Do Staten Island condominiums require board approval for sales?
Condominium sales generally not subject to board approval (right of first refusal only). Cooperative (co-op) sales require extensive board review including financial statements, personal interviews, reference checks, board package submission. Staten Island contains limited co-op inventory concentrated in North Shore buildings.
Get Professional Staten Island Home Valuation from Local Market Experts
Accurate Staten Island home value determination requires comprehensive market knowledge, proprietary data access, and neighborhood-specific expertise. Robert DeFalco Realty specializes in Staten Island micro-markets spanning all five geographic regions with direct SIMLS access and 40+ years local experience.
Professional CMA deliverables include:
- Detailed comparable sales analysis (10-15 properties)
- Current market condition assessment
- Recommended list price with supporting rationale
- Pre-listing improvement recommendations with ROI projections
- 30-day marketing and launch strategy
- Competitive positioning analysis
Average turnaround time: 24-48 hours for standard residential properties.
Investment required: Complimentary for prospective sellers, no obligation.
Next step: Request your free Staten Island home valuation or schedule 15-minute pricing consultation with licensed Staten Island specialist.
Contact Staten Island Real Estate Experts
Article updated September 2025 with current Staten Island market data, neighborhood valuations, and pricing trends.